Rental Market Recovers: Majority of Canadian Cities Saw Rents Continue to Grow
Similar to last month, nearly two-thirds of the Canadian cities on our report experienced growing rents again. The recovery from 2020’s rental market trends seems to have begun since there is a demand that is currently driving up prices. As many Canadian residents are likely to be fully vaccinated by the fall, renters may be preparing for a sense of normalcy slowly returning by beginning to search for their next apartments again.
Vancouver & Toronto Rents Climb for Second Month in a Row
Looking at the top markets, both Vancouver and Toronto continued to have rents grow for both bedroom types for the second month in a row. Meanwhile, Barrie dropped down to 4th after experiencing the largest monthly decline for one-bedrooms and Hamilton fell out of the top 10 to 11th.
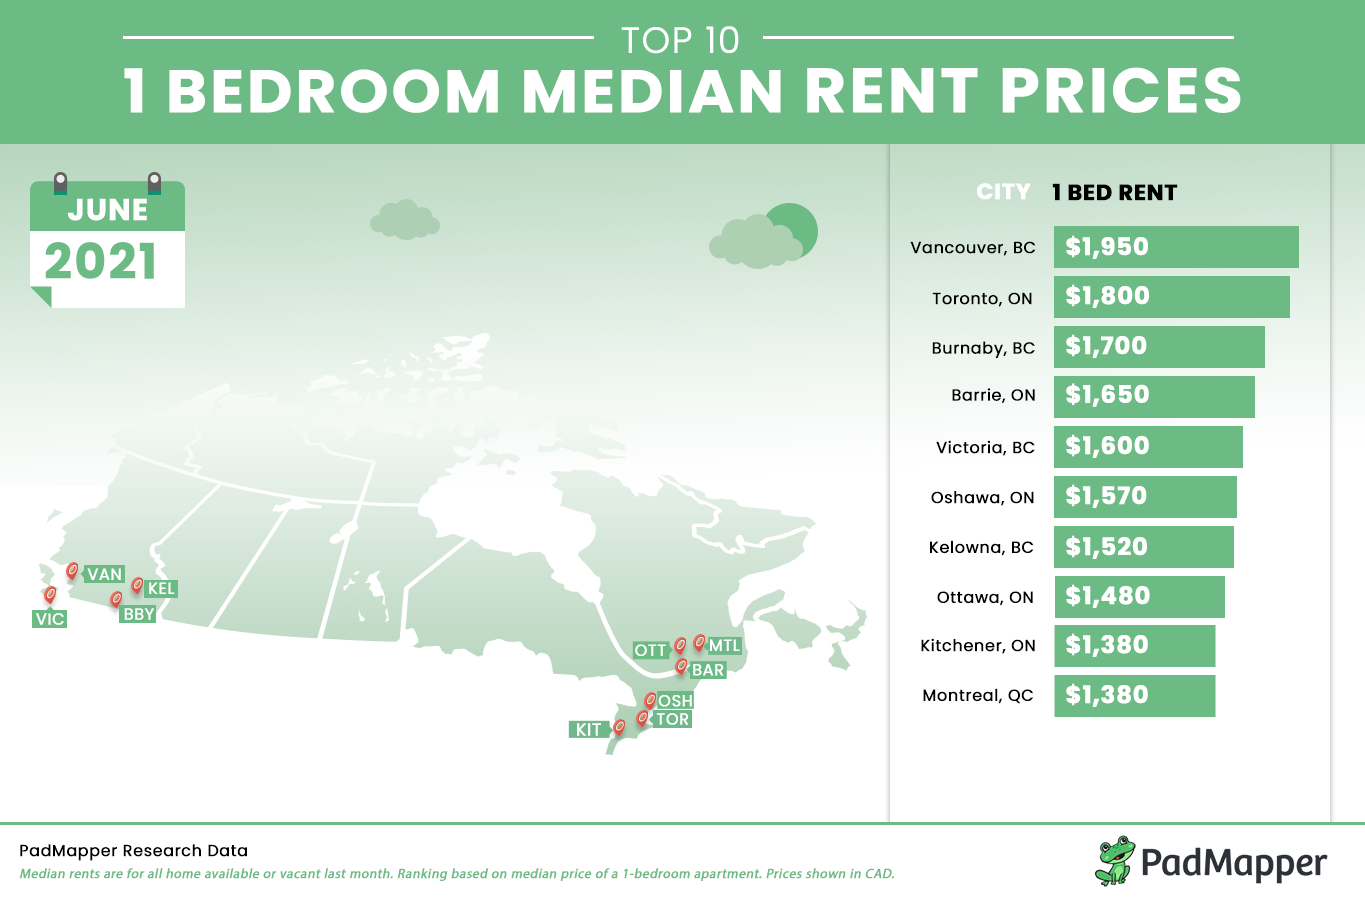
Top 5 Most Expensive Markets
1. Vancouver, BC continued to see climbing rents with one-bedroom rent growing 1% to $1,950 and two-bedrooms increasing 2.2% to $2,730.
2. Toronto, ON saw one and two-bedroom rents inch up 0.6% and 0.4%, respectively, to medians of $1,800 and $2,320, respectively.
3. Burnaby, BC moved up a spot to become the 3rd priciest city with one and two-bedroom rents priced at $1,700 and $2,270, respectively.
4. Barrie, ON dropped down to 4th with one-bedroom rent falling 4.6%, which was the largest monthly decline of any city in the nation, to $1,650.
5. Victoria, BC remained 5th, though one-bedroom rent increased a slight 0.6% to $1,600.
Cities with The Largest Monthly Changes
Upward
–Windsor, ON one-bedroom rent had the largest monthly growth rate, jumping 4.8% to $1,100.
–Abbotsford, BC moved up 2 spots to become the 12th priciest market with one-bedroom rent growing 4.7% to $1,330.
–Halifax, NS also climbed 2 positions, now tied with Abbotsford as 12th, with one-bedroom rent increasing 4.7% to $1,330 as well.
Downward
–St. Catharines, ON dropped 3 rankings to become the 15th most expensive city with one-bedroom rent falling 3% to $1,300.
–Hamilton, ON dipped down 2 spots, and out of the top 10 markets, to rank as 11th with one-bedroom rent decreasing 1.4% to $1,370.
–Regina, SK saw one-bedroom rent decline 1.1% to $870 and moved down a spot to 23rd.
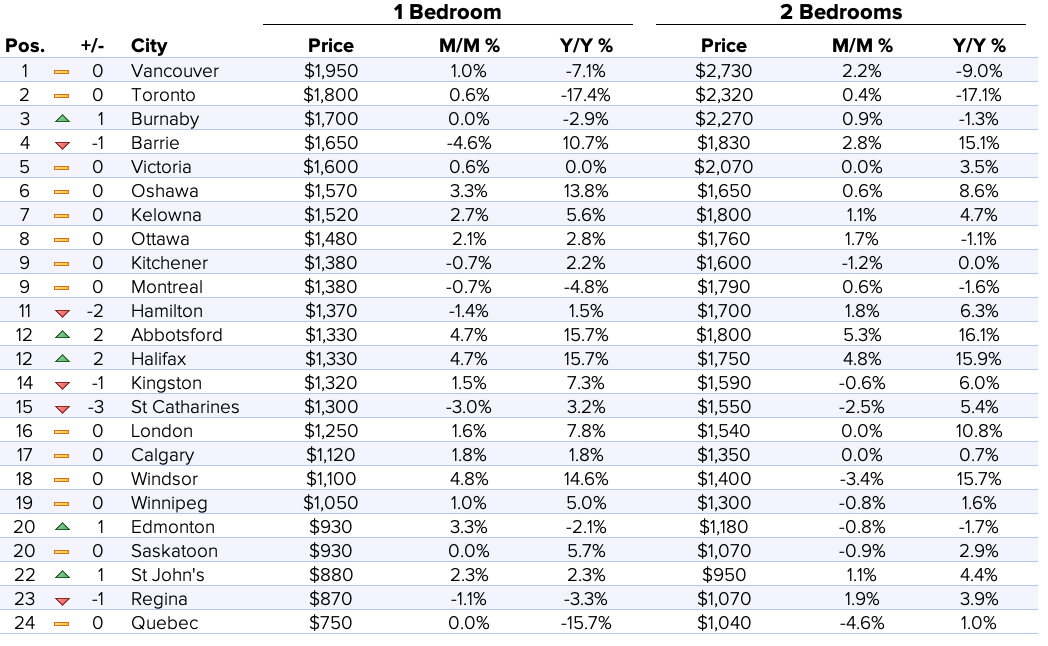
Full Data
| 1 Bedroom | 2 Bedrooms | ||||||
|---|---|---|---|---|---|---|---|
| Pos. | City | Price | M/M % | Y/Y % | Price | M/M % | Y/Y % |
| 1 | Vancouver, BC | $1,950 | 1.00% | -7.10% | $2,730 | 2.20% | -9.00% |
| 2 | Toronto, ON | $1,800 | 0.60% | -17.40% | $2,320 | 0.40% | -17.10% |
| 3 | Burnaby, BC | $1,700 | 0.00% | -2.90% | $2,270 | 0.90% | -1.30% |
| 4 | Barrie, ON | $1,650 | -4.60% | 10.70% | $1,830 | 2.80% | 15.10% |
| 5 | Victoria, BC | $1,600 | 0.60% | 0.00% | $2,070 | 0.00% | 3.50% |
| 6 | Oshawa, ON | $1,570 | 3.30% | 13.80% | $1,650 | 0.60% | 8.60% |
| 7 | Kelowna, BC | $1,520 | 2.70% | 5.60% | $1,800 | 1.10% | 4.70% |
| 8 | Ottawa, ON | $1,480 | 2.10% | 2.80% | $1,760 | 1.70% | -1.10% |
| 9 | Kitchener, ON | $1,380 | -0.70% | 2.20% | $1,600 | -1.20% | 0.00% |
| 9 | Montreal, QC | $1,380 | -0.70% | -4.80% | $1,790 | 0.60% | -1.60% |
| 11 | Hamilton, ON | $1,370 | -1.40% | 1.50% | $1,700 | 1.80% | 6.30% |
| 12 | Abbotsford, BC | $1,330 | 4.70% | 15.70% | $1,800 | 5.30% | 16.10% |
| 12 | Halifax, NS | $1,330 | 4.70% | 15.70% | $1,750 | 4.80% | 15.90% |
| 14 | Kingston, ON | $1,320 | 1.50% | 7.30% | $1,590 | -0.60% | 6.00% |
| 15 | St Catharines, ON | $1,300 | -3.00% | 3.20% | $1,550 | -2.50% | 5.40% |
| 16 | London, ON | $1,250 | 1.60% | 7.80% | $1,540 | 0.00% | 10.80% |
| 17 | Calgary, AB | $1,120 | 1.80% | 1.80% | $1,350 | 0.00% | 0.70% |
| 18 | Windsor, ON | $1,100 | 4.80% | 14.60% | $1,400 | -3.40% | 15.70% |
| 19 | Winnipeg, MB | $1,050 | 1.00% | 5.00% | $1,300 | -0.80% | 1.60% |
| 20 | Edmonton, AB | $930 | 3.30% | -2.10% | $1,180 | -0.80% | -1.70% |
| 20 | Saskatoon, SK | $930 | 0.00% | 5.70% | $1,070 | -0.90% | 2.90% |
| 22 | St John's, NL | $880 | 2.30% | 2.30% | $950 | 1.10% | 4.40% |
| 23 | Regina, SK | $870 | -1.10% | -3.30% | $1,070 | 1.90% | 3.90% |
| 24 | Québec, QC | $750 | 0.00% | -15.70% | $1,040 | -4.60% | 1.00% |
About
The PadMapper Canadian Rent Report analyzes rental data from hundreds of thousands of active listings across the country. Listings are then aggregated on a monthly basis to calculate median asking rents for the top 24 most populous metro areas, providing a comprehensive view of the current state of the market. The report is based on all data available in the month prior to publication. Any data that is reported does not include short term listings.
To keep up to date with rent changes across the country, like or follow PadMapper on Facebook and Twitter. In the market for a new place? Search apartments for rent on PadMapper.
Leave a Reply